
How Milwaukee’s Lakefront Brewery, Inc. Infuses Environmental Impact Monitoring in Its Process
April 6, 2026
Milwaukee and brewing have a deep, shared history. These days, that connection may stir up images of some of the United States’ most world-renowned brands. But when brewer families first immigrated to the city centuries ago, it meant doing two things they knew best: following a reliable process and spreading gemütlichkeit, a German word meaning warmth, friendliness, and good cheer.
Proudly building on Milwaukee’s brewing tradition, Lakefront Brewery, Inc. understands that a thoroughly-documented, detail-oriented perspective must be applied to how companies approach environmental stewardship and circularity (ESC). Everything must be measured so that the results can be carefully controlled. Over time, brewers can improve the outputs they get and seek even better results—just as they do with the beverages they produce.
At the same time, this work is done in the spirit of something bigger than what one brewery can accomplish alone: a movement built on gemütlichkeit and a collaborative vision of a healthier, more sustainable world.
ESC 1: Measuring to Maximize Impact
Lakefront’s commitment to the environment and its community stretches way back. First opened in 1987, the brewery made headlines when it sold the U.S.’s first certified organic beer and, later, its first government-certified gluten-free beer. In 2020, they became the first Certified B Corporation brewery in Wisconsin.
Despite technically being a medium-sized company, they have a large footprint. Their beers and other beverages are available in more than 25 states. With such a large presence, Lakefront takes its commitment to diligent ESC measurement seriously—but they also don’t do it alone. By relying on shared industry tools, free resources like the EPA’s Energy Star Portfolio Manager, and fellow professionals in the greater B Corp community, the company can monitor its environmental impact without reinventing the wheel.
They also take advantage of monitoring tools already baked into (or, more appropriately, brewed within) their process. Vendor and contract invoices, for example, allow them to know exactly which resources they’re bringing in and what non-product outputs they’re churning out.
ESC 1.1: Waste Monitoring
Under ESC 1.1, companies must measure the amount of waste they create and divert. After monitoring their waste generation patterns, they can take action in line with the Environmental Protection Agency’s waste hierarchy recommendations.
Accordingly, Lakefront diligently tracks all waste generated by its brewing operation and beer hall restaurant. For organic waste, spent grain is tracked via invoices from Rangen Agriculture, a company that collects used grain for cattle feed. Food waste is calculated from recipes and estimated. Recyclable waste, such as cardboard, aluminum, and stretch wrap, is monitored through recycling collection invoices. Similarly, solid waste data is calculated from invoices for landfilling services.
All data is recorded, consolidated, and tracked in a spreadsheet calculator. Finally, it’s entered into the Brewers’ Association Sustainability Benchmarking (BASB) Tool, which provides industry benchmarking and an overview of all waste streams. Lakefront also relies on the EPA’s Energy Star Portfolio Manager for data tracking and analysis. These tools overlap, says the company, so using both provides a way of verifying the accuracy of their data.
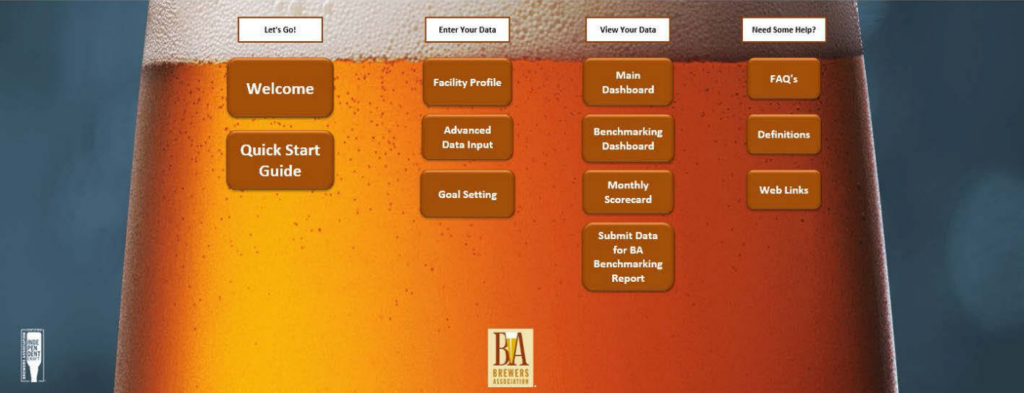
Screenshot of the Brewers’ Association Sustainability Benchmarking (BASB) Tool.
For other companies looking to begin tracking, Lakefront recommends looking at their own invoices as a first step. These hold the key to finding data on different waste streams, which can be consolidated using a simple tool like Excel. Then, they can use a tool like the Energy Star Tool (and, if they are a fellow brewery, the BASB Tool) to begin compiling data and visualizing their different waste streams.

Environmental Stewardship & Circularity (ESC) Impact Topic in Practice Guide
This guide from B Lab U.S. & Canada provides examples and resources from B Corps and partners to support companies in meeting requirements for the Environmental Stewardship & Circularity (ESC) Impact Topic.
ESC 1.2: Energy Monitoring
Lakefront sources energy consumption data directly from its utility invoices. This means no estimation is required. The company uses a combination of non-renewable electricity, natural gas, and renewable energy blocks to power its operations. It has also installed on-site solar panels at its warehouse. It tracks energy consumption and production separately across these sources to determine net impact.
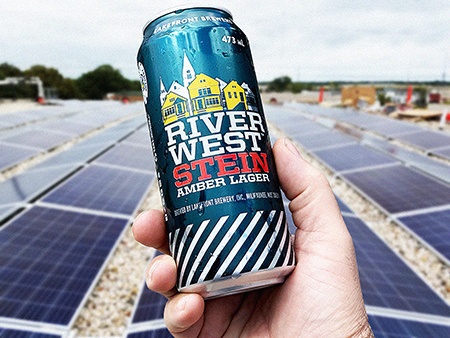
Lakefront installed solar panels on its warehouse to reduce off-site energy consumption. During warmer months, it can even become a net generator of electricity, allowing them to receive “purchase back” credits from the power company.
Similar to waste tracking, the company inputs all of its data from on-site generation and off-site consumption into a spreadsheet. Then, it compares and benchmarks its results in both the free Energy Star Tool and the BASB Tool.
Nailing the process down wasn’t always straightforward, so outside help proved invaluable. Reaching out to the Citizens Utility Board of Wisconsin, for example, helped Lakefront interpret its bill and understand complex utility concepts such as demand charges and time-of-use rates.
This information informed strategic adjustments. For example, after better understanding their bill, they decided to shift cooling processes to off-peak utility hours to reduce both expenditures and gross energy consumption.
ESC 1.3: Water Monitoring
Lakefront prioritizes water stewardship, as brewing is a highly water-intensive process. They track both water withdrawals using utility invoices and wastewater generation using volume data from the Milwaukee Metropolitan Sewer District.
These methods allow them to diligently monitor water as it arrives and leaves, with separate metering for their brewery/beer hall facility and warehouse. Using the data, the BASB Tool then breaks down and benchmarks water usage into categories, including process water used for brewing operations versus the wastewater with organics.

Lakefront participates in an Adopt-a-River cleanup twice a year, with some of their 2024 event volunteer team pictured here. They have also taken charge of the care of seven on-site drains through the city’s “Adopt-Your-Drain” program.
Similar to how it benchmarks energy intensity, the company seeks to normalize water intensity by measuring its consumption relative to production volume. The BASB Tool automatically calculates water intensity per barrel of beer produced.
After submitting annual sustainability data to the Brewers Association, Lakefront receives graphs comparing its water intensity with that of similar-sized breweries. This peer comparison helps determine whether the brewery’s water efficiency meets industry standards or if there are improvement opportunities.
Tapping Into Data to Take Action and Achieve Impact
In addition to collecting data, Lakefront has taken action to reduce its environmental impact, improve sustainability, and promote circularity within its regional economic ecosystem.
As mentioned above, they sell waste grain to feedlots and have installed EV panels at their facilities. In addition, they have installed a heat exchanger device at the brewery site, which recovers heat generated during the brewing process to reduce energy and water consumption throughout the building. A similar device, the Therma-Stor, funnels heat generated by refrigeration to warm cold water. LED lighting and programmable thermostats further reduce energy costs in their facilities.
Investments like these are important, but their installation doesn’t mark the end of the ESC process. Companies have an obligation to see what methods make a difference—and by how much. Tools like the EPA Energy Star Portfolio Manager can help them track changes and benchmark energy/water use and waste generation.
The insights they glean from monitoring data can then be used to set targets, inspire other projects, or inform process changes. Through a continual improvement cycle, they can work towards being part of a circular system, one that’s more regenerative than consumptive.
It Takes a Brew Hall

Lakefront’s approach to monitoring in compliance with the B Lab Standard V2.0 ESC 1 criteria is thorough, but it’s hardly homebrewed. Leaning on others in their process, industry, and greater community helps them integrate measurement into everything they do.
The company also relies on organizations like the Sustainable Business Council to source methodology and get support with implementation. Lakefront says that reaching out to organizations like these or local business hubs is a great starting point for others to begin their tracking.
Every little bit of effort can feel small, in the long run, but it eventually results in a well-earned payoff—a feeling of gemütlichkeit from the greater community after a job well done, just like enjoying a cold one at the end of a hard day’s work. Prost!
Want to Learn More?
Read the full case study from Lakefront Brewery and B Lab U.S. & Canada to get the full story on how Lakefront Brewery, Inc. answers the call to comprehensively monitor its environmental impact.
Sign Up for our B The Change Newsletter
Read stories on the B Corp Movement and people using business as a force for good. The B The Change Newsletter is sent weekly.